Volume 6 Number 1
©The Author(s) 2004
Seymour Papert's Vision for Early Childhood Education? A Descriptive Study of Head Start and Kindergarten Students in Discovery-based, Logo-rich Classrooms
Abstract
Seymour Papert's vision for early childhood education involves using Logo, a child-friendly computer language. He envisioned a discovery, or self-directed, method of teaching and learning. This article describes three observational studies conducted in classrooms that were attempting to implement Papert's vision. Data from 9 kindergartners and 5 Head Start children are reported that show what children were doing and with whom they were interacting when they used Logo throughout the school year. All children spent the bulk of their time constructing. No gender differences were found among the kindergartners in behavior, although social configuration differences among the kindergarten boys and girls were found. Head Start children showed more variation in behavior and social configuration than the kindergartners. Developmental, classroom, and racial differences between the Head Start and kindergarten studies are discussed.
Seymour Papert's Vision and Logo
In his 1993 introduction to the second edition of Mindstorms: Children, Computers, and Powerful Ideas, Seymour Papert wrote:
I see Logo as a means that can, in principle, be used by educators to support the development of new ways of thinking and learning…. During the 1970s, we had demonstrated that children of almost any age could learn to program in Logo under good conditions with plenty of time and powerful research computers…. I have seen hundreds of elementary school children learn very easily to program, and evidence is accumulating to indicate that much younger childrencould do so as well. (pp. xiv, xvi , 13)
Logo is a child-friendly computer language that was developed by Seymour Papert at the Massachusetts Institute of Technology in 1968. One way for children to use Logo is through a software program called MicroWorlds ™ (see Figures 1 and 2). This graphical software package allows children to create their own scenes (worlds) and program icons to move. Children can create pictures and develop short- or long-term projects. Another way for children to use Logo is through a Lego™ product commonly called Lego-Logo (see Figures 3 and 4). This product incorporates a small, but relatively heavy (compared with other Lego pieces), computerized and battery-operated RCX™ Lego piece (see Figure 3) that can be programmed to move the child’s Lego structure by using the computer language Logo to control Lego motors. This Lego piece is called a programmable brick by its developers (Resnick, Martin, Sargent, & Silverman, 1996).
Figure 1. Head Start students work with MicroWorlds Logo on laptops.
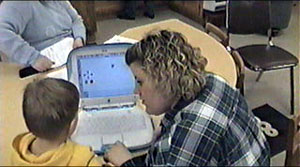
Figure 2. Head Start teacher assists student with MicroWorlds project.
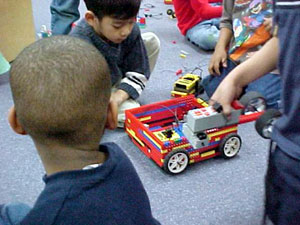
Figure 3. Kindergartners build using Lego-Logo with yellow RCX and gray battery box.
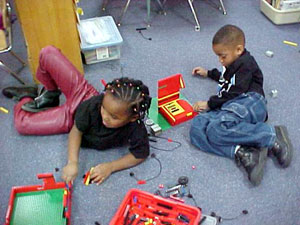
Figure 4. Kindergartners work on Lego-Logo projects.
Although a venerable body of research on the use of Logo in early childhood environments, including preschool, kindergarten, and first-grade classrooms, has developed since the mid-1980s, none of these studies describes the continuous classroom involvement of young children in Logo-rich environments that Papert envisioned. This article describes three studies that followed children in one kindergarten classroom for 2 years and children in a Head Start classroom for 1 year. All children had the opportunity to use Logo multiple times per week as part of their regular classroom curriculum (see Figures 2 and 4). Data were collected using an interval recording method (Katzdin, 1982) during the time that children were engaged in Lego-Logo activities to show frequencies and proportion of time that children spent interacting with Logo in various ways, as well as various social configurations during children’s interaction with MicroWorlds and Lego-Logo.
Review of the Literature
Benefits of Logo
Although early descriptive studies in the late 1970s and studies on the cognitive and social benefits of Logo throughout the 1980s and early 1990s produced conflicting results (Yelland, 1995b), benefits of Logo appear to include increased metacognitive ability (where children reflect upon their own thinking processes), improved problem-solving ability, and enhanced spatial orientation and ability, especially regarding shape and angle awareness (Clements & Nastasi, 1999; Clements & Sarama, 2002).
Developmental Appropriateness of Logo in Early Childhood
Figures 5 and 6 show 3- to 5-year-old children working with Logo. Clements (2001a) and others believe that mathematics should be introduced to children in preschool. Logo can be developmentally appropriate for children in Piaget’s preoperational stage (Gillespie & Beisser, 2001); that is, it may be appropriate for 3- to 6-year-old children. However, certain precautions must be taken. Children's thinking in Piaget’s preoperational stage is rule based, but not necessarily logical. Therefore, scaffolding their problem-solving techniques can be difficult because their problem solving may be based less on the evidence at hand and more on the children's preset ideas about what the computer needs or wants. In addition, children in this age range would not yet be expected to show consistent evidence of the concrete operational stage but would instead exhibit signs of centration, nonreversability, and egocentrism. These characteristics again can pose challenges in the logical world of computer programming.
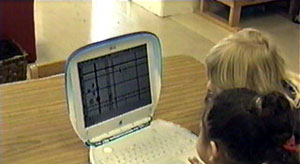
Figure 5. Head Start students, ages 3-5, work with MicroWorlds Logo.
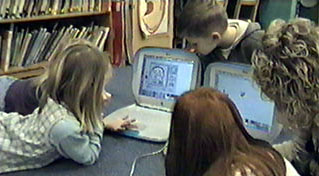
Figure 6. Head Start teacher works with a group of 3- to 5-year-old children.
Child's and Teacher’s Roles
Papert envisioned a discovery, or self-directed, method of learning (and therefore of teaching), which he clearly articulated in the first edition of Mindstorms, published in 1980. Robinson, Gilley, and Uhlig (1988) recognized that “Discovery LOGO requires, we believe, the LOGO-rich curriculum and environment with extensive keyboarding time and computer access … [but] the typical American public school does not have the financial resources to provide such an environment for all of its students” (p. 227). Fortunately, because of the falling prices of computers since the 1980s, a Logo-rich curriculum environment is now much more financially feasible for schools.
In reviewing numerous studies conducted by Clements and his colleagues between 1983 and 1999, Clements and Nastasi (1999) concluded that “the project approach to Logo engaged children in all aspects of problem solving…. An open question is whether it is necessary or efficient to have children spend substantial amounts of their time engaged in self-directed problem solving” (p. 17). They concluded that this activity is not only necessary but also efficient because (1) children must build their own schemata, making direct teacher instruction insufficient, (2) students must initiate and use higher-order thinking skills, and (3) individual student-teacher interactions do not account for student variance on metacomponential test scores, but students’ level of active engagement in problem solving does account for this variance. These mathematics activities must be included in the preschool curriculum for the benefit of all students, but particularly for children from minority and low-income groups who are at risk for experiencing considerable difficulty later on in math (Clements, 2001a; Clements & Sarama, 2002). So it seems that Papert’s vision of a Logo-rich environment in which children are given time to work on self-directed Logo projects in the presence of a teacher who is also discovering Logo and is facilitating, but not forcing, children’s learning is not only possible today, but it can also be seen as necessary and efficient if children (especially minority and low-income children) are to reap social and cognitive benefits from using Logo.
Early Descriptive Studies
Johnson (1985) observed that when given the choice to use computers during center time, preschoolers who chose to use computers frequently were older, more cognitively mature boys and girls. These children were more representationally competent, more organized, more focused, and less concrete in their play than children who chose to use computers less often. He concluded that children must possess a certain level of representational competence before they will be attracted to computer use. Essa (1987) explored a similar free-choice computer option and found that children (both boys and girls) who chose to use the computer during center time were displacing their art involvement with computer use. She found no deleterious effect on children’s socialization. In another descriptive study of non-Logo preschool computer use, Shade, Nida, Lipinski, and Watson (1986) observed children’s social interactions when using the computer. They found that children rarely used the computer alone. Children’s assisting behavior (helping their peers) increased over time, and their positioning for a turn at the computer decreased as they formed natural dyads and triads and worked cooperatively. Genishi, McCollum, and Strand (1985) studied oral language that occurred over 3 months while kindergartners and first-graders used Logo in a computer laboratory and while the same kindergartners used a computer as a free choice activity during center time in their classroom. They found that children were not afraid of the computer and that the children’s computer activity was highly sociable, involving both peers and teachers.
Results-Oriented Studies
Early descriptive studies of how preschoolers interact with computers and with each other around computers soon gave way to more individual results-oriented research. Miller and Emihovich (1986) asked whether mediated instruction in Logo programming would have a greater effect on 5-year-olds’ self-monitoring during a referential communication task than would an attention-control group where children received skills-based instruction in computer games. Using a sequence of lessons in a guided discovery approach to Logo, they found that during the block building post-test task, the Logo group children were more likely to recognize ambiguous directions and explain the errors in the faulty building instructions than were the control children. Degelman, Free, Scarlato, Blackburn, and Golden (1986) asked whether 5-year-olds exposed to 15 minutes of single keystroke Logo per school day for 5 weeks were better at rule-learning problems than the control group, who were waiting to receive the classroom pull-out Logo training. They found that the Logo group had a significantly higher proportion of correct rule identification responses on the two problems that were administered to all children. If the tasks in these studies—recognizing and articulating faulty building instructions and rule identification—can be agreed to be aspects of logical thinking abilities, then these studies show that 5-year-old children who have been exposed to Logo under various circumstances can score higher on logical thinking tasks than children who have not been exposed to Logo.
Some researchers have pointed out some of the specific advantages to children of directly engaging in computer programming. Kafai (1996) wrote that “through programming, children learn to express themselves in the technological domain” (p. 38). Resnick (2001) argued that one of the benefits of programming with Logo is that children develop a fluency with technology such that they learn to master the technological environment and to become not just consumers but creators of new technologies.
In a case study of six 6-year-old children learning with Logo, Yelland (1994) examined a boy-boy, a girl-boy, and a girl-girl pair of children’s performance on a Logo task. She found some initial gender differences, but later research (Yelland, 1995a) revealed that after children became familiar with Logo, the only gender differences they exhibited were in social interaction behaviors.
In 1986, Clements found that after 22 weeks of Logo, first- and third-graders improved in the areas of classification, seriation, metacognition, creativity, and describing directions. Computer-assisted instruction (CAI) was also effective at improving third-graders' classification skills. Clements argued that Logo may be a more powerful treatment for first- than third-graders, because first-graders are likely to be in a period of structural transition regarding classification and seriation. More recently, Clements has focused on the importance and benefits of children’s experiences with spatial and geometric concepts, starting with Logo (Clements & Burns, 2000) and extending to other software that emphasizes these math skills (Clements, 2001b).
Wilson, Mundy-Castle, and Sibanda (1991) also compared Logo and CAI, but they found no greater cognitive effects in the Logo group among their sample of Black and White 8-year-old Zimbabwean girls. The researchers did not measure children’s metacognitive ability, problem solving, or creativity. They explained that because of the way that Logo was implemented in this school, possible benefits of using Logo were muted. Students and teachers were totally unfamiliar with computers. Teachers received some background in Logo, but they did not learn about Logo philosophy or how to facilitate children’s Logo experience. They also warned that Logo might not be culturally appropriate in Zimbabwe because Logo was developed in the west and might not be culturally familiar or relevant outside Euro-American societies.
Two noteworthy studies conducted in the United States address the issue of Logo among children in marginalized cultures. Emihovich and Miller (1988) studied first-graders’ response to Logo. They exposed children to Logo or CAI for 3 months, twice a week. A no-treatment control group received regular classroom instruction. Analyzing their findings by race, Emihovich and Miller found that Black children benefited more from Logo than White children, as reflected by significant increases on the CTBS (California Test of Basic Skills) and MFFT (Matching Familiar Figures Test). They noted that “computer programming may be beneficial to minority children because it provides them with a sense of mastery over their environment” (p. 477) and gives them opportunities to use metacognitive skills, which they may not have had before experiencing Logo. In closing, the authors implored that “more research is needed on the use of interactive and problem-solving software with minority students to demonstrate that these students can profit from computer usage beyond acquiring basic skills” (p. 484).
Reeder and Leming (1994) studied Black and White rural third-graders living in poverty. They rejected the notion that discovery Logo was an effective teaching or learning method and opted instead for a treatment of 8 weeks of Logo instruction in a computer lab in which the students were presented with 16 problem-solving tasks. Nonetheless, the Logo group’s nonverbal reasoning test (Matrix Analogies Test) scores showed significant improvement after treatment, whereas the no-treatment control group did not improve. In the closing sentence of their article, the authors wrote, “These children are among the most needy in our society, and the research community should not ignore them in the development of bodies of knowledge on effective educational practices in a technological age” (p. 563).
Just as the early descriptive studies gave way to more individual results-oriented studies, there is now the beginning of a resurgence of descriptive studies depicting children’s computer use. Kerawalla and Crook (2002) provided new information by observing the differences between children’s computer use at home and at school. Other useful information for practitioners has been provided through descriptive case studies of ways to use new forms of Logo in the classroom (Klopfer, Colella, & Resnick, 2002). Clearly, the need for updated descriptive data about how children are using the current technology never diminishes.
Research Questions
The research reported in this article addressed the following question, not answered by previous Logo research: How do minority and low-income young children interact with Logo when they are given regular and continuous opportunities to work with it (using the discovery approach) throughout the school year? Studies 1 and 2 examined minority and low-income kindergartners in an inner city setting. Study 3 examined low-income Head Start students in a rural setting.
Method
Children from two classrooms participated. Data were taken for 2 years in a kindergarten classroom (Studies 1 and 2) and one year in a Head Start classroom (Study 3). Study 1 laid the foundation for Studies 2 and 3, which were both built on the observational data and experiential knowledge gained during Study 1.
Subjects
Study 1. Study 1 describes the first year of data collected in the kindergarten classroom, depicted in Figure 7. The kindergarten classroom was in an urban midwestern U.S. public magnet school for the fine arts that children attended for a full day, five days a week. Although the school in which the kindergarten is located is a magnet school, most of the children in the classroom throughout the year were from the local, inner-city neighborhood, and most were low income and non-White. Low income is evidenced in the public school setting by a high percentage of children in the school receiving free and reduced lunch. Eighty-three percent of children at this school receive free or reduced lunch (Des Moines Public Schools, 2002).
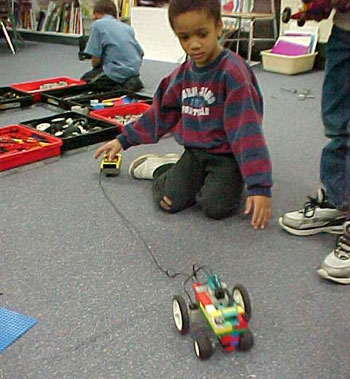
Figure 7. Kindergarten site where data for Study 1 were collected.
In Study 1, we determined that it would be feasible to focus our observations on a maximum of four target children for two observation sessions (a little over an hour each) per week. We chose two girls, one Black (Keesha) and one White (Mary), and two boys, one Black (Jamal) and one White (Holden), as target children in the interest of gender balance and in order to reflect the classroom's ethnic diversity. During the school year, one of the target children moved out of the district, leaving us with three target children at the end of the year.
Study 2. Study 2 describes the second year of data collected in the kindergarten classroom, when five target children were observed. After experiencing one of our target children unexpectedly moving during Study 1, and because we wanted as many target children as possible in Study 2 in case the same thing happened, in planning Study 2, we reevaluated the feasible number of target children and determined that it would be possible to observe up to five target children.
In Study 2, we chose two girls, one Black (Leticia) and one White (Blanca), and three boys, two Black (Damien and Pierre) and one Latino (Eddie), as target children in order to accurately reflect gender and ethnic diversity in the classroom during that academic year.
Study 3. Study 3 describes one year (the same academic year as Study 2, the second year of kindergarten data) of data collected in the Head Start classroom. The Head Start classroom, depicted in Figure 8, was a rural midwestern U.S. class. The children attended for half-days, four days a week. Children ranged in age from 3 to almost 5 at the beginning of the school year. Most of the children in the Head Start classroom were White. All were low income. Low income is evidenced by the requirement that Head Start families meet strict (low) income guidelines in order to qualify for this federal program.
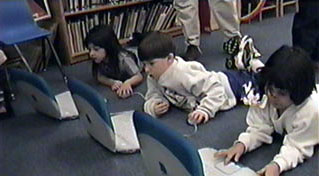
Figure 8. Head Start site.
Target children were chosen differently in Study 3 than in Studies 1 or 2. All 13 children in the classroom were observed whenever they used MicroWorlds. In Study 3, the computer was a free choice activity (competing with the usual mixture of dramatic play, blocks, etc.), and therefore target children were those who were observed most frequently choosing to use MicroWorlds on the computer. Although Lego pieces were available in the Head Start classroom, Lego-Logo was not available (children were building with Lego pieces, but not programming), so data in Study 3 are limited to MicroWorlds use.
Over the course of the year, all 13 children in the classroom were observed at least once using MicroWorlds. The five target children whose data are reported in this article were the children who most frequently used MicroWorlds. They were all White, one 4-year-old girl (Danielle), one 4-year-old boy (Peter), one 3-year-old boy (Jonathan), and two 5-year-old boys (Ralph and Rich). This gender distribution did not reflect the approximately 50/50 gender distribution in the classroom, because the target children were self-selected by their own use of the materials, and in this classroom, girls (and younger children) used MicroWorlds less frequently than did boys (and older children).
Settings
Kindergarten Site: Studies 1 and 2. In the kindergarten classroom, children had “Lego-Logo time” two or three days a week for an hour or more each time. Although Lego-Logo time was scheduled three times per week, one session per week was often canceled because of assemblies, early dismissals, and so forth. During Lego-Logo time, children chose between MicroWorlds (loaded onto both laptop and desktop computers) or building with Lego pieces, which could be programmed using the RCX bricks and Logo software (see Figure 9). Children did not have the choice to engage in any activity other than MicroWorlds or using Lego pieces; therefore, participation in these activities was high. In general, playing with Lego pieces was more popular than using MicroWorlds. Although access to MicroWorlds was somewhat limited because of a set number of computers (numbers of computers varied depending on how many were lent out to other classrooms, but there were always at least five computers available, and sometimes up to 10), it was frequently the case that one or two computers were free, while children chose to build with Lego pieces instead.
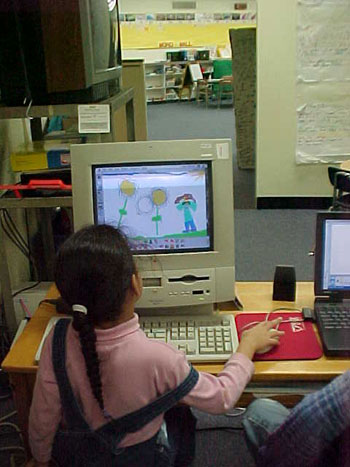
Figure 9. Children used MicroWorlds at the kindergarten site.
The teacher often began Lego-Logo time with a short “how to” technical group lesson, or even more frequently, she suggested a way for children to integrate their learning earlier in the day into Lego-Logo time. For instance, when they were studying patterns in math, the teacher challenged children to make “wrapping paper”-like patterns in MicroWorlds, and when they were studying the solar system, she suggested they program planets to orbit the sun.
The discovery approach was very much in place in the kindergarten classroom. Children were encouraged to chose an activity and to be self-directed learners. The teacher issued challenges and offered suggestions and assistance, but the teacher did not give assignments during Lego-Logo time. Both Lego and MicroWorlds projects were saved from day to day until they were complete. Children worked individually or in small groups, as they wished. Completed Lego projects were photographed before being deconstructed. MicroWorlds projects were saved electronically and sometimes also photographed (see Figure 10). In both Studies 1 and 2, a number of Lego projects involved a small group of students. One project was the creation of an ice cream factory; another involved inventing and constructing various pieces of equipment for Sparkle, the class guinea pig (see Figure 11).
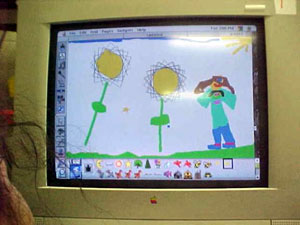
Figure 10. A kindergartner worked on this MicroWorlds project.
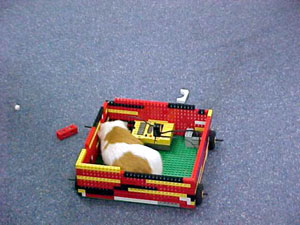
Figure 11. Sparkle the guinea pig takes a ride in her Logo-programmed vehicle.
In the Head Start classroom, MicroWorlds (loaded onto desktop and laptop computers) was available as a choice for children during center time (see Figure 12). Other choices included Lego pieces (but not computerized RCX bricks), housekeeping, woodworking, and other learning centers. In Study 3, children were observed much less frequently than in Studies 1 and 2 in part because there were fewer classroom visits but also because children had so many activities from which to choose during the observation period. Children in the Head Start classroom had the opportunity to use MicroWorlds daily, but participation was generally low. Instead, children frequently chose the housekeeping area or other learning centers.
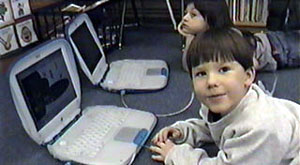
Figure 12. Head Start students work on MicroWorlds projects.
Ample computers were available in the Head Start classroom (five laptops and two desktops). Laptop computers were stored in a cabinet, and if the teacher did not place them on tables for children during center time, she would always entertain a child’s request to get them out. Instruction and support in MicroWorlds in the Head Start classroom were much more individualized than in the kindergarten classroom. There were no group lessons or challenges, but rather the discovery approach was solely employed whereby children explored the program and interacted with the teacher or one of the participant-observers to learn how to use the program. Both the teacher and the participant-observers employed modeling techniques; for example, they got something moving on the screen and sparked nearby children’s interest to do the same (see Figure 13). MicroWorlds projects were routinely saved from day to day for children to work on later. Because of the nature of this Head Start classroom, where more activities are individualized or for a small group and not for the whole group, MicroWorlds was less comprehensively integrated into the curriculum than it was in the kindergarten classroom.
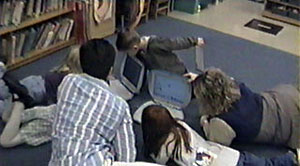
Figure 13. Two teachers work with children in the Head Start classroom.
Data Collection and Coding
In all three studies, one to three researchers were in the classroom at the same time. When more than one researcher was in the classroom, one researcher observed the children for part of the observation period and collected data, while the other(s) participated with the children and assisted them in their work on MicroWorlds or Lego-Logo. The researchers then switched roles. Therefore, the researchers were acting both as participants and as observers. In both classrooms, each child (triggered by the time of one minute passing in the kindergarten classroom or the event of using MicroWorlds in the Head Start classroom) was observed for half a minute. The child was coded for the following behaviors: (1) what media they were using (MicroWorlds, Lego pieces, or other), (2) with whom they were involved (alone, with one or more peers, with an adult, or with peers and an adult), and (3) what they were doing. In each case, only one behavioral category was recorded by the observer. If observers thought that children were engaged in more than one behavior, they chose the more comprehensive behavior; for example, they chose “demonstrating” over “talking” if the child was engaged in both behaviors, because demonstrating includes talking. This methodological approach, using a sequence of behavioral measures that are repeated in a specific order every 5 minutes throughout an observation period, has been used successfully in the past by researchers studying children’s use of books in early childhood classrooms (Gillespie, Pelren, & Twardosz, 1998).
Study 1: Developing the Scheme. We developed a behavioral categorization system after collecting data for the first half of the year in Study 1, consistent with Strauss and Corbin’s (1990) qualitative coding procedures. These behavioral categories are described in Table 1. Using our narrative data from all four target children after winter break during Study 1, we constructed categorical descriptions of the children's behavior during Lego-Logo time. Working together, separately, and then together again, the primary researcher and two research assistants agreed on the categories listed in Table 1, which included all behaviors observed during Lego-Logo time in this kindergarten classroom. For consistency during Study 1, all narrative observations (for both fall and spring semesters) were assigned a behavioral category by two research assistants during data analysis, not during classroom observation time.
| Behavior | Examples of What Was Observed |
|---|---|
| Constructing | Jamal is starting a new project with a yellow brick. Right now he is looking for pieces to build his project. He is working alone with Legos. |
| Using construction | Four children race the cars they have constructed. |
| Role playing | Mary is still playing house in the corner. She and her friends are not adding pieces to their project, but they are making up stories. “You can be 19 and tomorrow's your birthday, because I’m 20 already.” Mary leaves area to get Legos to add to house. |
| Demonstrating | A student is watching while Jamal shows him everything his project can do. “I learned, guess why?…’Cause a long time ago my car fell apart, and I built it back up…I learned…because my car kept going around and around.” |
| Observing | Mary is observing Jamal while he is programming a turtle. Keesha is observing the teacher programming a car. |
| Listening | Holden is listening to the teacher's explanation. |
| Talking | Keesha is talking with the teacher in the Lego area. |
| Asking | Jamal has just asked a child for help. Jamal’s car is turning in circles. |
| Disengaging | Jamal walks the Legos outside of the circle. He wanders a bit but seems to be aware that I am watching him. |
| *Behaviors observed less than 10% of the time are excluded. | |
Study 2: Using the Scheme. During the second year in the kindergarten classroom, we used the observation sheet (see the appendix) that was developed in Study 1. The procedure followed a time-sampling interval recording method (Katzdin, 1982) to observe the target children. Each target child was observed for 30 seconds once every 5 minutes on a one-minute interval time schedule.
Study 3: Adapting the Scheme. In the Head Start classroom, observation of children was triggered not by the passing of time (which was only appropriate in the kindergarten classroom where all children were engaged in MicroWorlds or Lego-Logo) but rather by the fact that a child chose to work on MicroWorlds during center time. After a child chose to use MicroWorlds in the Head Start classroom, the same time-sampling interval recording method that was employed in the kindergarten classroom was used to observe the Head Start students. Therefore, the observer may have been idle for a time if there were no children using MicroWorlds. When a child or children started using MicroWorlds, each child was observed for 30 seconds every 5 minutes and coded for behaviors using the observation form found in the appendix.
Observations. In the kindergarten classroom, 34 observations were conducted in each of Studies 1 and 2, with each target child being observed an average of 285 times (range 267-305) across Studies 1 and 2. In Study 3, 16 observations were conducted in the Head Start classroom, with 13 children being observed an average of 8 times (range 1-17). Because of the wide range of numbers of observations in the Head Start classrooms, the 8 children who were observed only 1-8 times throughout the entire year were not considered for this analysis, leaving 5 children who were observed an average of 15 times (range 9-17) throughout the year.
Inter-rater reliability checks were conducted on 10% of the classroom visits across all three studies, using the point-by-point agreement method (Katzdin, 1982) where agreements were divided by agreements plus disagreements for each 5-minute observation interval. This analysis revealed 100% agreement on the activity in which the children were engaged (MicroWorlds or Lego) and 85% (range 80-100% agreement for each 5-minute observation interval) on with whom the child was interacting (i.e., alone, with a peer, or with a teacher), as well as on the behavior in which the child was engaged (e.g., constructing, using construction) across all three studies.
Results
What Were They Doing?
Study 1. Table 2 shows that all four target children in Study 1 spent the bulk of their time constructing. The range of percentage of time observed constructing during either the fall or spring semester was 32-80. Holden and Mary increased the time they spent constructing from fall to spring, whereas Jamal and Keesha decreased the time they spent constructing. Interestingly, Holden, Jamal, and Mary all averaged 72-73% of their time spent constructing throughout the kindergarten year (34 observations). Keesha’s percent of time constructing average was quite a bit lower, at 41% (based on 26 observations only, due to her unexpected move out of state).
The data are shown in two semesters in Table 2 to reflect changes in children's behavior over time as they became more familiar, more comfortable, and more expert with the materials throughout the year. Although all four target children showed a strong preference for constructing, their second-most-likely behavioral category varied. By the end of the year, only Keesha had one behavior other than constructing that she engaged in 10% of the time. The other three target children did not show strong preferences toward behaviors other than constructing.
Study 2. The data presented in Table 2 for Damien, Eddie, Pierre, Leticia, and Blanca validate the data from Study 1 by showing that all five target children in Study 2 also spent the bulk of their time constructing. The range of percentage of time observed constructing was 53-85 in the fall or spring semester, 59-80 when averaged over the entire year. Only Blanca increased the time she spent constructing from fall to spring. Eddie held constant, whereas Damien, Pierre, and Leticia decreased the time they spent constructing. For all children but one, average percent of time spent constructing throughout the kindergarten year (34 observations) was slightly lower than in Study 1, ranging from 59-68, as compared with Holden, Jamal, and Mary’s averages of 72-73. The outlier in Study 2, Leticia, spent a high 80% of her time constructing, whereas the outlier in Study 1 only spent 41% of her time constructing.
Table 2 shows that more children in Study 2 had a behavior other than constructing in which they engaged 10% of the time or more. Eddie and Pierre spent 22% and 27% of their time respectively using their constructions, and Damien spent 11% of his time talking to adults or peers.
| Child | Behavior | Fall | Spring | Average |
|---|---|---|---|---|
| Holden1 | Constructing | 66 | 80 | 73 |
| Demonstrating | * | 11 | * | |
| Jamal1 | Constructing | 76 | 67 | 72 |
| Mary1 | Constructing | 69 | 76 | 73 |
| Role playing | 12 | * | * | |
| Keesha1 | Constructing | 45 | 32 | 41 |
| Using construction | 12 | * | 10 | |
| Talking | * | 10 | * | |
| Damien2 | Constructing | 73 | 53 | 63 |
| Using construction | 10 | * | * | |
| Talking | * | 15 | 11 | |
| Disengaging | * | 10 | * | |
| Eddie2 | Constructing | 64 | 64 | 64 |
| Using construction | 22 | 21 | 22 | |
| Pierre2 | Constructing | 62 | 56 | 59 |
| Using construction | 28 | 25 | 27 | |
| Talking | * | 10 | * | |
| Leticia2 | Constructing | 85 | 74 | 80 |
| Blanca2 | Constructing | 65 | 70 | 68 |
| Using construction | 11 | * | * | |
| Ralph3 | Constructing | 33 | 100 | 67 |
| Demonstrating | 17 | * | * | |
| Asking | 17 | * | * | |
| Rich3 | Constructing | 67 | 50 | 59 |
| Talking | 17 | 50 | 34 | |
| Danielle3 | Constructing | 38 | * | * |
| Role playing | 13 | * | * | |
| Observing | 19 | * | * | |
| Listening | 13 | * | * | |
| Disengaging | 13 | * | * | |
| Jonathan3 | Constructing | 50 | * | * |
| Listening | * | 100 | * | |
| Asking | 17 | * | * | |
| Disengaging | 17 | * | * | |
| Peter3 | Constructing | 60 | * | * |
| Using construction | * | 25 | * | |
| Observing | 20 | 25 | 23 | |
| Talking | * | 25 | * | |
| Asking | * | 25 | * | |
| Venting | 20 | * | * | |
|
*Indicates less than 10%. 1Study 1; first year of kindergarten data. 2Study 2; second year of kindergarten data. 3Study 3; Head Start data. | ||||
Study 3. It is perhaps inappropriate to try to compare the data between Studies 1 and 2 (kindergarten) with Study 3 (Head Start), because there were so many differences in the age of the students, classroom setup, and even in the number of observations that were conducted. However, it would be noteworthy if the data were similar; therefore, the data are presented in a manner that makes comparison possible.
Table 2 shows that during the fall, the five target children in the Head Start classroom spent the bulk of their time constructing, but by spring, only one child was primarily involved in constructing, the others having moved on to other behaviors such as talking and listening, or no longer choosing MicroWorlds as an activity. The range of percentage of time observed constructing was less than 10 to 100. Two of the five Head Start students (Rich and Ralph) were observed constructing an average of 59% and 67% of the time they engaged in MicroWorlds—figures that are consistent with the average percentages observed in Studies 1 and 2. The remaining three Head Start students were observed constructing in MicroWorlds less than 10% of the time.
Data by Age and Gender. Table 3 reports the same average data as in Table 2 but by age and gender. When only year-end averages are used, the Head Start girl, Danielle, and one Head Start boy, Jonathan, drop out because they did not have any one behavior that was observed 10% or more of the time throughout the year when interacting with MicroWorlds. Data are presented in Table 3 for all behaviors exhibited by any target child 10% or more of the time on average throughout the school year. These behaviors are limited to constructing, using their constructions, and talking. Means are presented for children who showed the behavior 10% or more of the time, excluding cells in which the data are not presented because the frequency fell below the 10% cutoff. Kindergarten boys (from Studies 1 and 2) and kindergarten girls (also from Studies 1 and 2) both averaged 66% of their time constructing throughout the school year. Ralph and Rich, the Head Start boys who were observed 10% or more of their time constructing throughout the school year, averaged 63% of their time constructing. The gender and age differences in these numbers are that all the Head Start girls were excluded because their numbers were too low, and all but two Head Start boys were excluded because their numbers were also too low. The using construction and talking data are presented, but well more than half of the target children had to be excluded because of their low numbers, so the averages presented may not be as meaningful as the data from the kindergarten classroom, but they are presented for comparative purposes.
| Child | Constructing | Behavior Using Construction | Talking |
|---|---|---|---|
| Holden1 | 73 | * | * |
| Jamal1 | 72 | * | * |
| Damien2 | 63 | * | 11 |
| Eddie2 | 64 | 22 | * |
| Pierre2 | 59 | 27 | * |
| Means: Kindergarten Boys (excluding * cells) | 66 (all 5 cells included) | 25 (3/5 cells excluded) | 11 (4/5 cells excluded) |
| Mary1 | 73 | * | * |
| Keesha1 | 41 | 10 | * |
| Leticia2 | 80 | * | * |
| Blanca2 | 68 | * | * |
| Means: Kindergarten Girls (excluding * cells) | 66 (all 4 cells included) | 10 (3/4 cells excluded) | * (4/4 cells excluded) |
| Ralph3 | 67 | * | * |
| Rich3 | 59 | * | 34 |
| Peter3 | * | 23 | * |
| Means: Head Start Boys (excluding * cells) | 63 (1/3 cells excluded) | 17 (2/3 cells excluded) | 34 (2/3 cells excluded) |
| Overall Total Means (excluding * cells) | 65 (1/12 cells excluded) | 21 (8/12 cells excluded) | 23 (10/12 cells excluded) |
|
*Indicates less than 10. All behaviors observed 10% of the time or more, on average
over the school year, are reported. 1Study 1; first year of kindergarten data. 2Study 2; second year of kindergarten data. 3Study 3; Head Start data. |
|||
With Whom Were They Interacting?
Study 1. Although data were collected on social configurations for every behavior observed, Table 4 shows only how much time each target child spent alone, with a peer, with an adult, or with a peer and an adult while children were constructing (other behaviors were infrequently or inconsistently observed). The target children in Study 1, Holden, Jamal, Mary, and Keesha, showed remarkable similarities in their social patterns. All children were most likely to be alone when constructing. Their number two social configuration was being with a peer (Holden and Jamal) and being with an adult (Mary and Keesha). All target children spent the least amount of time in adult/peer groupings.
Study 2. As in Study 1, Table 4 shows how much time each target child spent alone, with a peer, with an adult, or with a peer and an adult while constructing in Study 2. In the second year of data collection in the kindergarten classroom, the target girls (Leticia and Blanca) and one target boy (Eddie) were most likely to be alone when constructing, consistent with the results from Study 1. However, the two other target boys (Pierre and Damien) were most likely to be with a peer. Second-most-likely social configurations were alone (Pierre and Damien), with a peer (Blanca and Eddie), and with an adult (Leticia). As in Study 1, all children spent the least amount of time in adult/peer groupings.
Study 3. Table 4 also shows how much time each target child spent alone, with a peer, with an adult, or with a peer and an adult when constructing in Study 3. Ralph and Peter were most likely to be alone when constructing; Rich was most likely to be with a peer. Ralph and Rich’s second-most-likely social configuration was with an adult. Peter spent 100% of his time alone. Consistent with the results of Studies 1 and 2, target children in Study 3 spent the least amount of time in adult and peer configurations.
| Child | Social Configuration While Constructing | |||
|---|---|---|---|---|
| Alone | With Peer | With Adult | With Adult(s) and Peer(s) | |
| Holden1 | 69 | 19 | 14 | 06 |
| Jamal1 | 56 | 24 | 21 | 03 |
| Damien2 | 36 | 40 | 18 | 06 |
| Eddie2 | 48 | 33 | 13 | 06 |
| Pierre2 | 42 | 46 | 06 | 06 |
| Means: Kindergarten Boys | 50 | 32 | 14 | 05 |
| Mary1 | 64 | 15 | 18 | 02 |
| Keesha1 | 45 | 18 | 31 | 06 |
| Leticia2 | 64 | 16 | 18 | 02 |
| Blanca2 | 48 | 36 | 08 | 08 |
| Means: Kindergarten Girls | 55 | 21 | 19 | 05 |
| Ralph3 | 83 | 0 | 17 | 0 |
| Rich3 | 22 | 33 | 44 | 0 |
| Peter3 | 100 | 0 | 0 | 0 |
| Means: Head Start Boys | 68 | 11 | 20 | 0 |
| Overall Total Means | 62 | 25 | 19 | 04 |
*All social configurations observed while constructing over the school year are
reported for children in Table 3. | ||||
Data by Age and Gender. The data in the table are presented by age and gender, again including only kindergarten boys, kindergarten girls, and Head Start boys, because none of the Head Start girls was observed constructing frequently enough to be reported. The patterns of social configurations do seem to be different among the kindergarten boys and girls. All kindergarten boys preferred to be alone or with a peer, and three of the kindergarten girls preferred to be alone or with an adult (except Blanca, who, like the kindergarten boys, preferred to be alone or with a peer). Still, the means for kindergarten boys and girls show on average a preference among both groups first for being alone, second for being with a peer, third for being with an adult, and last for being with an adult and a peer. The Head Start boys’ social configuration pattern is not as clear. Two of the three boys were most likely to be alone. Rich was most likely to be with a peer. The second-most-likely social configurations were with an adult for Ralph and Rich. Averages show that for the Head Start children, being alone was the most commonly observed social configuration, followed by being with an adult, and then being with a peer. All children spent less time in adult/peer groupings.
Discussion
Summary of Results
When minority and low-income kindergartners in an inner-city setting interacted with MicroWorlds and Lego-Logo on a regular and continuous basis (using the discovery approach) throughout two school years (Studies 1 and 2), they spent most of their time constructing. The average percent of time observed constructing during Lego-Logo time over the school year for both kindergarten boys and girls was 66%. Head Start students using the discovery approach (Study 3) to explore MicroWorlds were also observed to spend more time constructing on average than engaging in other behaviors, although there was more variation among the Head Start children. Kindergartners were most likely to be alone or with a peer when constructing, whereas Head Start students were most likely to be alone or with an adult while constructing. All children spent less time in adult/peer groupings.
Gender Differences
There were no systematic gender differences between the kindergarten girls and boys with regard to their behavior during Lego-Logo time. There were some differences in social configurations, with three of the kindergarten girls being observed with an adult as a second-most-likely social configuration, whereas none of the boys was observed with an adult as their second-most-likely social configuration. Kindergarten boys’ first- and second-most-likely social configurations were all either alone or with a peer. In other words, kindergarten girls and boys were doing the same things, but they were sometimes in different social configurations, with boys gravitating toward peers when girls gravitated toward an adult (or perhaps adults gravitated toward the girls).
Gender differences did appear among the Head Start girls and boys, because girls were either never interested in MicroWorlds or lost interest in it over time, whereas two boys maintained their involvement. There were also boys who were not interested in MicroWorlds or who lost interest in it over time. Because of this lack of sustained interest, only the results of three Head Start boys could be reported, and the boys’ data could not be compared with girls’ data because girls were so infrequently observed using MicroWorlds.
Developmental Differences
The possible gender difference issue in the Head Start classroom is confounded by the multiple differences in the kindergarten and Head Start children. First, there are developmental differences. Head Start children were all ages 3 or 4 on September 15. If they were age 5 on that date, they would have been required to attend prekindergarten or kindergarten instead of Head Start. All of the kindergartners, by state law, were at least 5 years old on September 15, and many of them were 6 years old. Therefore, there was a one- to three-year age span between the Head Start children and the kindergartners.
Classroom Differences
The classroom organization and concomitant procedure for observing children was different between the two classrooms. Children in the kindergarten were given a choice between MicroWorlds and programmable Lego pieces during Lego-Logo time. Children in the Head Start classroom were given many more choices, such as blocks, woodworking, and dramatic play. Although the Head Start children were encouraged by the teacher and research assistants to choose MicroWorlds during center time, they were not required in any way to do so. So the fact that most of the girls and some of the boys in the Head Start classroom were not interested in MicroWorlds may mean that there was something else more appealing to them that they were choosing to do.
Racial Differences
There were racial differences between the Head Start and kindergarten children, but there were not major income differences. Both schools serve low-income families, but the rural Head Start had primarily White students, whereas the inner-city kindergarten had a more diverse racial population. All of the Head Start target children were White, whereas only three of the nine target kindergartners were White. Because of all the other differences involved in the populations, it is unclear what effect these racial differences may have had.
Strengths
These descriptions of children’s activity in Logo-rich environments suggest that Logo can be successfully used in low-income early childhood classrooms. Seymour Papert’s vision of discovery Logo can be realized through different approaches according to the classroom’s needs and culture. The Head Start classroom profiled in this article aspired to Papert’s vision by using MicroWorlds as a center activity, whereas the kindergarten classroom realized Papert’s vision with both Lego-Logo and MicroWorlds during whole-class Lego-Logo time regularly throughout the week. Because the kindergarten approach was more effective in getting all target children engaged with Logo, it is the author’s recommendation that this model be emulated: Discovery Logo for the entire class 2 or 3 days per week for an hour or more each time.
The subjects in this study are minority and low-income young children. Many researchers have urged that minority and low-income children’s interaction with computers and technology be documented, and this article accomplishes that goal. Children’s engagement with technology goes well beyond the acquisition of basic skills. It is not known what the long-term effects of such a program will be, but it is possible that such early, equal access to computer technology will contribute to the closing of the digital divide when these children enter middle and high school. Employing discovery Lego-Logo with all children in a low-income classroom may have a positive effect on the already closing digital divide, whether it is a perceived divide between Whites and Blacks (ONLINE, 2003), rich and poor (Koretz, 2002), or urban and rural dwellers (Mills & Whitacre, 2003).
Another contribution of these studies is to confirm others’ research findings. Consistent with past research, there were gender and developmental differences regarding social configurations while using the computer and Lego-Logo. Although almost all children’s first choice was to work alone, among the older children, boys were more likely to work with a peer than girls and girls were more likely to work with an adult.
The need for updated descriptive data about how children are using the current technology never diminishes. Girls and boys profiled in this article used Logo on the computer with MicroWorlds software and in conjunction with Lego-Logo. The data presented herein provide evidence to support the assertion that it is possible to successfully implement Papert’s vision of discovery Logo with 5- and 6-year-olds in a kindergarten classroom. The data do not support a conclusion that Logo can be successfully used by all children in a Head Start classroom. More data are needed before any conclusions are made about the Head Start center-based choice model presented in this article.
Limitations
Although this research design was intended to match Papert’s vision by using a discovery approach to teaching and learning and a process approach to research, it can be criticized for not being able to answer the question “What effect does Logo have on young children?” Data reported here show how children interacted with constructionist learning tools, not the short- or long-term effects of their Logo experience. However, the longitudinal descriptions of children’s behavior found in this study go well beyond descriptive data found in most outcome studies. Children were followed for an entire school year, and in the case of Studies 1 and 2, two years of data were collected in the same classroom.
The research design could also be criticized based on the differences between the kindergarten (Studies 1 and 2) and Head Start (Study 3) classrooms. It is true that there were many differences in the classrooms and the way data were able to be collected. Although data were collected and are presented in a manner that makes comparison possible, it may not be appropriate to compare the two because of the number of inconsistencies between the environments. However, one benefit of presenting these three studies together is that the reader can see the evolution of the observation protocol and the application of the scheme in alternate settings.
Possibilities for Future Research
Consistent with a desire to manifest Seymour Papert’s vision for early childhood education, future research could address qualitative studies involving individual profiles of target children while they are engaged in Logo-based computer programming. Other possibilities for future research include gender and racial differences, ability differences (how children of different abilities interact with Logo), and a more detailed developmental profile of children’s interactions with Logo, both by age and by experience with Logo. Finally, a further investigation of Head Start children’s interaction with Logo is warranted before any conclusions can be drawn about whether Seymour Papert’s vision can be realized in a Head Start preschool setting.
References
Clements, Douglas H. (1986). Effects of Logo and CAI environments on cognition and creativity. Journal of Educational Psychology, 78(4), 309-318. EJ 339 575.
Clements, Douglas H. (2001a). Mathematics in the preschool. Teaching Children Mathematics, 7(5), 270-275. EJ 670 455. (Also available: http://www.gse.buffalo.edu/FAS/Clements/Files/Preschool_Math_in_TCM.pdf [2004, April 2].)
Clements, Douglas H. (2001b). On math, music, and more. Early Childhood Today, 15(4), 46.
Clements, Douglas H., & Burns, Barbara A. (2000). Students’ development of strategies for turn and angle measure. Educational Studies in Mathematics, 41(1), 31-45. EJ 607 154.
Clements, Douglas H., & Nastasi, Bonnie K. (1999). Metacognition, learning, and educational computer environments. Information Technology in Childhood Education Annual, 5-38. EJ 595 775.
Clements, Douglas H., & Sarama, Julie. (2002). The role of technology in early childhood learning. Teaching Children Mathematics, 8(6), 340-343. EJ 658 166. (Also available: http://my.nctm.org/eresources/view_media.asp?article_id=1897 [2004, April 2].)
Degelman, Douglas; Free, John U.; Scarlato, Michelle; Blackburn, Janice M.; & Golden, Thomas. (1986). Concept learning in preschool children: Effects of a short-term Logo experience. Journal of Educational Computing Research, 2(2), 199-205. EJ 336 306.
Des Moines Public Schools. (2002). Des Moines Public Schools report card. Edmunds Academy of the Fine Arts 2001-2002. Des Moines, IA: Author.
Emihovich, Catherine, & Miller, Gloria E. (1988). Effects of Logo and CAI on black first graders’ achievement, reflectivity, and self-esteem. Elementary School Journal, 88(5), 473-487. EJ 372 535.
Essa, Eva L. (1987). The effect of a computer on preschool children’s activities. Early Childhood Research Quarterly, 2(4), 377-382. EJ 363 997.
Genishi, Celia; McCollum, Pamela; & Strand, Elizabeth. (1985). Research currents: The interactional richness of children’s computer use. Language Arts, 62(5), 526-532. EJ 322 098.
Gillespie, Catherine W., & Beisser, Sally R. (2001). Developmentally appropriate LOGO computer programming with young children. Information Technology in Childhood Education Annual, 232-247. EJ 639 715.
Gillespie, Catherine W.; Pelren, Suzanne L.; & Twardosz, Sandra. (1998). An ecological perspective on the voluntary book use of 2- and 3-year-olds in day care. Early Education and Development, 9(3), 283-306. EJ 569 090.
Johnson, James E. (1985). Characteristics of preschoolers interested in microcomputers. Journal of Educational Research, 78(5), 299-305. EJ 319 294.
Kafai, Yasmin B. (1996). Software by kids for kids. Communications of the ACM, 39(4), 38-39.
Katzdin, Alan E. (1982). Single-case research designs: Methods for clinical and applied settings. New York: Oxford University Press.
Kerawalla, Lucinda, & Crook, Charles. (2002). Children’s computer use at home and at school: Context and continuity. British Educational Research Journal, 28(6), 751-771.
Klopfer, Eric; Colella, Vanessa; & Resnick, Mitchel. (2002). New paths on a StarLogo adventure. Computers and Graphics, 26(4), 615-622.
Koretz, Gene. (2002, December 9). Narrowing the digital divide. Business Week, 3811, p. 28.
Miller, Gloria E., & Emihovich, Catherine. (1986). The effects of mediated programming instruction on preschool children’s self-monitoring. Journal of Educational Computing Research, 2(3), 283-297. EJ 341 582.
Mills, Bradford F., & Whitacre, Brian E. (2003). Understanding the non-metropolitan-metropolitan digital divide. Growth and Change, 34(2), 219-243.
ONLINE. (2003, May 2). Chronicle of Higher Education, 49(34), A37.
Papert, Seymour. (1980). Mindstorms: Children, computers, and powerful ideas. New York: Basic Books.
Papert, Seymour. (1993). Mindstorms: Children, computers, and powerful ideas (2nd ed.). New York: Basic Books.
Reeder, Lillian Kay, & Leming, James S. (1994). The effect of Logo on the nonverbal reasoning ability of rural and disadvantaged third graders. Journal of Research in Computing Education, 26(4), 558-564.
Resnick, Mitchel. (2001). Closing the fluency gap. Communications of the ACM, 44(3), 144-145.
Resnick, M., Martin, F., Sargent, R., & Silverman, B. (1996). Programmable bricks: Toys to think with. IBM Systems Journal, 35(3/4), 443-452. (Also available: http://www.research.ibm.com/journal/sj/353/sectionc/martin.pdf [2003, April 5].)
Robinson, M. A.; Gilley, William F.; & Uhlig, George E. (1988). The effects of guided discovery Logo on SAT performance of first grade students. Education, 109(2), 226-230.
Shade, Daniel D.; Nida, Robert E.; Lipinski, Judith M.; & Watson, J. Allen. (1986). Microcomputers and preschoolers: Working together in a classroom setting. Computers in the Schools, 3(2), 53-61. EJ 341 638.
Strauss, Anselm, & Corbin, Juliet. (1990). Basics of qualitative research: Grounded theory procedures and techniques. Newbury Park, CA: Sage.
Wilson, David; Mundy-Castle, Alistair; & Sibanda, Pauline. (1991). Cognitive effects of LOGO and computer-aided instruction among Black and White Zimbabwean primary school girls. Journal of Social Psychology, 131(1), 107-116.
Yelland, Nicola. (1994). A case study of six children learning with Logo. Gender and Education, 6(1), 19-33. EJ 500 614.
Yelland, Nicola. (1995a). Logo experiences with young children: Describing performance, problem-solving, and social contexts of learning. Early Child Development and Care, 109, 81-74. EJ 507 184.
Yelland, Nicola. (1995b). Mindstorms or storms in a teacup? A review of research with Logo. International Journal of Mathematics Education Science and Technology, 26(6), 853-869.
Author Information
Dr.
Catherine Wilson Gillespie is an associate professor at Drake University School
of Education in Des Moines, Iowa, where she teaches early childhood education
and human development. She received her Ph.D. in child development from the University
of Tennessee in 1995, her M.Ed. from Lesley College in 1988, and her B.A. from
Wellesley College in 1984. She has been involved in research with young children
who are at risk for school failure for the past 10 years. This article grows out
of Dr. Gillespie's participation in the Iowa Early Childhood Papert Partnership,
a collaborative partnership among Seymour Papert, Drake University, Drake University
Head Start, Des Moines Public Schools, Norwalk Public Schools, and the Heartland
Area Education Agency.
Catherine Wilson Gillespie
Drake University School of Education
3206 University
Avenue
Des Moines, IA 50311
Telephone: 515-271-4602
Fax: 515-271-4140
Email: Catherine.Gillespie@drake.edu
Appendix
Sample
Observation Form*
| Date: 12/25/02 | Classroom: K | Observer: C |
Time: 12:00 Target: AB |
|
|
| Description: Hatches turtle and programs it FD1. Forgets space. Has trouble decoding error message. Starts looking around for help. |
Time: 12:01 Target: CD |
|
|
|
Description: Builds vehicle. Talks to friend about how to get it to go faster. Looks for new motors at friends’ suggestion. |
Time: 12:02 Target: EF |
|
|
|
Description: Plays with twirling construction that they have just finished. Hold their hands up for it to hit when it passes them. It makes about a 1 foot in diameter circle. |
| *Each actual form reflected 5 minutes of data and observations of four or five target children. | ||||