Volume 12 Number 2
©The Author(s) 2010
Successful versus Unsuccessful Schools through the Eyes of Children: The Use of Interviews, Autophotography, and Picture Selection
Abstract
Although “top-down” indicators, such as the ratio of adults to children in classrooms and program rankings based on standardized test scores, can predict some of the future impact of children’s education, “bottom-up” factors, such as whether children feel welcome and whether they find the learning activities to be meaningful and engaging, may have a greater effect on children’s long-term development. Yet little is known about children’s perceptions of their schools and how their views may differ depending on the type and quality of schools they attend. In the present study, three methods—interview, autophotography, and picture selection—were employed to learn about children’s perceptions of their schools and whether their perspectives differed depending on whether they attended schools labeled “successful” or “unsuccessful.” The 156 participants in kindergarten to fifth grade (ages 5 to 11) were interviewed about their school experiences. In the context of making books about their schools, children took photographs that they felt would show others what the schools were like. They also selected photographs from a standardized set of other photographs—one they thought “best showed” their school and one that showed what was “most important” to them. The following were among the results: (1) Participants at the unsuccessful school were more likely to identify school as being about academics and evaluation/tests and less about play/fun, especially in the early grades. (2) The importance of friendships was more evident among children at the successful school than among children at the unsuccessful school. (3) Among participants from both schools, the pictures that children selected that “best showed” their school usually differed from what was “most important” to them.
Introduction
In an article about program quality in early childhood education, Katz (1993) detailed several possible perspectives on the quality of programs for young children. One of these perspectives is what Katz termed the top-down perspective, which includes such factors as ratio of adults to children in the classroom and amount of classroom space. Other easily observed and quantified factors, such as program rankings based on standardized test scores, may also be aspects of a top-down perspective.
Student performance on standardized tests has become central in describing overall individual school performance—and, by implication, quality—for public schools in the United States, including those that serve children in kindergarten through second grade (see National Commission on Excellence in Education, 1983; Yell & Drasgow, 2005; Lee & Wong, 2004; Cross, 2004; Dorn, 1998). Under the No Child Left Behind (NCLB) Act, states can set their own trajectories for moving students toward the goal of 100% proficiency by 2013-2014; states also determine their own ways to measure students’ progress. Schools are considered “accountable” for test scores, but interpretations of school accountability and the role of standardized tests can vary from state to state. In Florida, where this study took place, the Florida Comprehensive Achievement Test (FCAT) was established as Florida’s standardized achievement test for assessing students’ mastery of the “Sunshine State Standards,” which were adopted in 1996. Florida public school and charter school students in grades 3 through 11 currently take some form of the FCAT (reading, writing, math, and/or science) each year (Florida Department of Education, 2010). Private school students are exempt from this requirement.
Under NCLB, definitions of “successful” and “unsuccessful” schools also vary among states. For example, in Florida, every public school or charter school receives a letter grade based on the school’s FCAT results: “A” (the highest grade), “B,” “C,” “D,” or “F” (the lowest grade).
Also among the perspectives on quality addressed by Katz (1993) is the bottom-up perspective, which represents viewpoints of the children in a program—for example, whether children feel welcome and whether they find the learning activities to be meaningful and engaging. While there is general agreement that top-down indicators in a school can predict some of the future impact of children’s education, Katz (1993) suggested that bottom-up factors may have a greater effect on children’s long-term development. Yet little is known about children’s perceptions of their schools and how their views may differ depending on the type of school they attend.
Approaches to Studying Children’s Perspectives
A variety of methods of data collection may be useful in gaining children’s bottom-up perspectives on their school experiences. This study employed three methods in combination—interviews, autophotography, and a picture selection task.
Interviews
Exclusive use of interviews is not viewed as optimal for collecting data from young children. Although vocabulary acquisition changes dramatically from the early childhood period onward—from the first word around 8 to 14 months of age, to approximately 300 words by 24 months, to 60,000 words by the age of 18 (Ganger & Brent, 2004)—young children may not be able to verbally express all of their ideas or knowledge about a topic. Also, an unequal power structure may be present when adults interview children that may influence children’s responses (Hayden & Ward, 1996). Children’s interview results may also be affected by “demand characteristics”—the tendency of people (regardless of age) to say what they think an interviewer wants to hear (Orne, 1962).
Photography
Using photography with participants can circumvent some of the perceived disadvantages of using interviews alone and can help to provide deeper knowledge of the person’s views. A review of the literature revealed many different names for data collection methods that involve using photographs to augment interviews or having participants take photographs to reflect an experience. Four of these methods are described briefly below—photo elicitation, photolanguage, fotonovela, and autophotography.
Photo elicitation has been most commonly used in studies within anthropology and sociology. In such studies, photographs or other images (e.g., video) are shown to participants in order to obtain richer descriptions during interviews. In a review of photo elicitation studies, Harper (2002) claimed that the “images evoke deeper elements of human consciousness than do words; exchanges based on words alone utilize less of the brain’s capacity than do exchanges in which the brain is processing images as well as words” (p. 13). The photographs used in photo elicitation studies typically display individuals’ usual activities and life, but individuals may see or may describe those activities in new ways when they view the photographs.
A second method known as photolanguage (e.g., White, Sasser, Bogren, & Morgan, 2009) also utilizes photographs during the interview process. The photographs—typically black-and-white images—are chosen specifically for their potential to elicit emotional responses from the individuals who view them. Akeret (2000) said, “In a sense, photographs are a language unto themselves” (p. 13).
Neither photo elicitation nor photolanguage places the camera in the hands of the participant. Two other methods of data collection—fotonovela and autophotography—do so. For example, in a study by Kirova, Fauza, and Emme (2006), children created a book with photographs that they took to show children who were new to the school what lunchtime was like. This method, known as “fotonovela,” had primarily been used in health and nursing, but Kirova et al. used it to study the differences between immigrant and non-immigrant children’s perspectives of a routine school event.
The approach most similar to the one used in the present study is what Ziller (1990) labeled “auto-photography” (spelled “autophotography” in this article). The participant receives a camera to take photographs that answer a question posed by the researcher. In one such study, adolescents were asked to take photographs to answer the question, “Who Am I?” Ziller (1990) claims that taking photographs may empower people, allowing them to frame their world without constraints that might be imposed by the researcher’s assumption about what would be important to them. Autophotography’s standardized procedures enable the researcher to make comparisons among the participants or among different groups. Ziller and Rorer (1985), for example, compared the photographs taken by shy and non-shy college students.
Autophotography has not often been employed in research with young children. One study that used autophotography compared what children from ages 3 to 12 thought was important about a field trip to the zoo (DeMarie, 2001). The results showed both quantitative and qualitative differences among the photographs taken by children of different ages. For example, the youngest children (i.e., ages 3 to 5) not only took a significantly lower percentage of photographs of animals, they also photographed different types of animals than the oldest children (i.e., ages 9 to 12). Instead of photographing animals unique to the zoo, the preschool children photographed only animals that were already familiar to them either at home (e.g., goats, chipmunks, or snakes) or at school (e.g., goldfish).
Picture Selection
The author and colleagues (DeMarie, Foyle, & Mulé, 2010) developed a picture selection procedure to circumvent possible limitations of autophotography with young children. This picture selection task presents children with a standardized set of labeled, representative photographs on “stimulus cards.” An interviewer asks the child to select a card in response to questions such as, “Which picture best shows what your school is like?” or “Which of these is most important to you?” The order in which a child selects pictures is used to estimate the importance of the depicted items to that child. Children do not need to leave the interview location as they do with autophotography; thus, the picture selection task provides a more standardized way to gain children’s perspectives.
In a study in a school that received a “C” grade from the state of Florida in a middle-income, suburban neighborhood, DeMarie et al. (2010) found that interviews and photography yielded consistent results across time when children had the same teacher and were in the same classroom. There also was some convergence of findings across the different methods of data collection, especially with regard to the presence or absence of friends mentioned, photographed, or selected as representing what school was like. Autophotography and picture selection added to what was learned about children’s perceptions of school, but none of the results of any method duplicated the findings from other methods completely.
Research Questions
The study described herein examines and compares “bottom-up” perspectives of children in two elementary schools in Florida. One of the schools had a grade of “A” according to the state’s accountability measures and was considered “successful”; the other had a grade of “F” and was considered “unsuccessful.” In addition to the between-school comparisons of children’s perceptions regarding their schools, we looked for within-school commonalities and differences between grade groups (i.e., kindergarten-second grade and third-fifth grade). The following questions were explored through a combination of interviews, autophotography, and a picture selection task:
- Does the prevalence of themes represented in interviews with children differ by the child’s age or by the school’s “grade” (i.e., an “A” school or an “F” school)?
- Does the prevalence of themes represented in children’s autophotography differ by the child’s age or by the school’s “grade” (i.e., an “A” school or an “F” school)?
- Does the prevalence of themes represented in children’s responses to the picture selection task differ for children from the “A” school and those from the “F” school?
- Do children in either school who are less successful academically take fewer photographs and/or select photographs that contain people later than their more academically successful peers?
Method
Setting
Both participating schools were charter schools in Florida and were in urban areas considered “disadvantaged neighborhoods.” Neither school offered bus service for students. Enrollment in the charter schools was based on a lottery system. Students applied to attend them; names were selected randomly from a list of applicants stratified by race/ethnicity to insure that the schools’ populations were representative of the district’s racial and ethnic demographics. At the time of the study, Florida charter schools received slightly lower public funding than public schools. Although charter schools were free from the curriculum requirements for the district’s public schools, their students took the FCAT tests during the same time as public school students, and the schools were “graded” in the same manner as all public schools. The school that was considered “successful” had received a grade of “A” from the state. The “unsuccessful” school had received a grade of “F”; in fact, one year following data collection, it was closed permanently. (Private school students are not required to take this test, and the private schools are not graded.)
When the researchers observed at both schools outside of the context of interviews and autophotography, very different types of instruction were noted. Instruction at the “F” school seemed to be less thematic and more focused on drilling facts and procedures. Children at the “F” school usually did worksheets, working alone in quiet classrooms. Every time we entered an “F” school classroom, the children all seemed to look up and to notice our entry. In contrast, children at the “A” school rarely seemed to notice our entry; they were usually involved in group work, using not only their classroom but also the hallways and the outdoors to conduct their work. They usually studied thematic units, took occasional field trips to enhance their learning, made displays to show their learning, and seemed to have more freedom to talk to one another and to move around the classroom and school building than did students at the “F” school.
Participants
Of the 156 child participants in this study, 83 were males and 65 were females (8 parents did not disclose their child’s sex on the consent form). There were 123 who attended the “successful” school and 33 who attended the “unsuccessful” school. Sixty-five were in kindergarten, 29 in first grade, 10 in second grade, 25 in third grade, 9 in fourth grade, and 18 in fifth grade (mean age = 7.23). Parents of all participants signed consent forms, and the children gave verbal assent to participate.
We grouped participants according to grade: the “younger grade group” (kindergartners to second-graders) and the “older grade group” (third- to fifth-graders). One reason to divide the children in this manner was that Florida’s “high-stakes” testing began in third grade (see Florida Department of Education, 2010), giving children in third through fifth grade significant classroom experiences in common. Separation by grade also aligned with physical divisions within the schools themselves. Children in kindergarten to second grade were housed on the ground floor of the “A” school, while those in third to fifth grade were housed on the second floor. The grades were similarly divided in the “F” school, where classrooms were separated by hallway location within one floor.
Each participant in the study was rated by his or her teacher on an achievement rating form as a “low,” “average,” or “high” achiever when compared with others in that grade at that school or when compared with others in that grade nationally. Teachers at the “A” school rated 9 children as low achievers, 13 as average achievers, and 16 as high achievers compared with others in their grade at that school. They also rated 5 children as low achievers, 17 average, and 16 high when compared with others in their grade nationally. The mean national percentile scores for children at this school who participated in the present study were 66.48 (SD = 23.82) for reading and 66.49 (SD = 23.96) for math. Although the “F” school teachers did not complete the requested achievement rating forms, we obtained permission from parents to access 16 of the children's mean scaled scores for the FCAT. They ranged from 151 to 382. The FCAT is a criterion referenced test, and a score of 300 is required for the score to be considered a “passing” score by the state of Florida. At the “F” school, 13 of the 16 children scored below 300 in reading, and 12 of the 16 scored below 300 in math. This was the reason for the school's “F” grade from Florida. Few children scored above 300.
Procedure
Interviews. All interviews took place in the hallways outside of the children’s classrooms at a table and two chairs. Children were initially interviewed by a university undergraduate or graduate student. Children were told that the researchers were making a book about their school and were asked if they would like to take photographs for that book. Then the interviewer said that he or she would like to ask the child some questions before proceeding. Children were asked the following questions:
- Tell me about a day at your school.
- What do you do when you are at school? Do you do anything else?
- What is your favorite thing to do at school?
- What does your teacher teach you at school?
- What have you learned in school this year?
- What did you learn in school yesterday?
- What is your favorite thing to learn at school?
- What is the most special thing about your school?
- Is there anything else you would like to tell me about your school?
If the child did not respond to a question or did not say, “I don’t know,” the question was repeated, but after an additional 10 seconds, the interviewer asked the next question. Interviews lasted approximately 15 minutes. All responses were audiotaped and later transcribed for coding.
Autophotography. During the interview session, children were shown how to take photographs with the large, Sony digital camera. (Most had no previous experience with one.) When taking a picture, the experimenter helped them to steady the camera. Interviewers asked the children what they would like to photograph first for inclusion in the book, and their responses were recorded. After the child took the picture, the child and interviewer returned to the interview location and viewed the photograph on the 2.5-inch LCD screen. The interviewer then said the following:
- Tell me about the picture.
- Why did you take that picture?
- How does that picture show your school?
The same procedure was used for the second and third pictures after the children were reminded that they could “take a picture of anything” that showed their school. They were not permitted to leave the school grounds.
Picture Selection Task. The author’s experience using this task during a previous study (see DeMarie et al., 2010) led to the conclusion that 11 photographs would be optimal for the picture selection task. Each stimulus card featured a labeled photograph that depicted some aspect or part of the school. A number of labels were chosen based on findings from previous research; others were seen as helping to distinguish between two possible perspectives (e.g., “doing schoolwork” versus “learning new things”; “friends” versus a classroom with no people labeled “my classroom”). Teachers assisted the researcher in obtaining photographs from their schools to represent each of the labels. The labels and descriptions of photographs are shown in Appendix A.
The picture selection task was administered to each child at least one week following the first interview by someone who did not conduct the initial interview. Stimulus cards were shown to children in a set order. After the interviewer read each label and the child repeated them, the interviewer placed the stimulus cards face up on the table in a 4-row matrix. Each child was first asked to select the picture that he or she thought best showed others what the school was like. The child then gave that stimulus card to the interviewer. This procedure was repeated until all of the stimulus cards were selected. When the child reached the final selection, the interviewer said, “You’ve picked this picture last. That tells me that you don’t think this picture shows your school. Why not?” The interviewer recorded the order of the child’s selections and the child’s responses to questions about selections. Finally, the interviewer returned all 11 stimulus cards in one stack to the child and said, “Now, of all these, which is the most important to you?” The child’s selection was recorded.
Coding
Interview data from both schools were transcribed and then coded using the coding categories displayed in Appendix B. After reading all transcripts and seeing that some new themes were needed to represent what these children said, the researchers added the items marked with asterisks as thematic categories. Each question’s response was coded separately. If a child’s response addressed a general coding category more than once within a question (e.g., answering the question, “What do you learn at school?” with “I learn math, reading, writing, and about math”), it was counted only once in that category. However, if the child gave specific information about what was learned (e.g., “I learn how to count, how to add numbers, and how to subtract”), each response was counted (i.e., “3” for the math category).
Two independent coders reviewed children’s interviews or autophotography choices. They reached 92% agreement when coding the “A” school interviews and 91% agreement when coding the “A” school photographs. Two different independent coders reached 97% agreement when coding the “F” school interviews and 98% agreement when coding the “F” school photographs. A third independent coder coded those interviews or photographs on which the coders had disagreed. New rules were generated from the first two coders’ discussions following their comparisons. In Appendix A, if only a bolded theme is shown, that bolded theme also was used as a coding category. If a bolded theme also encompassed unbolded categories, the unbolded categories were also used for coding, with totals for the unbolded coding categories added together to obtain a total for the bolded theme. For example, the bolded theme “Behavior Management” was used as both a coding category and as a theme, but the theme “Food” was not. Because the unbolded coding categories of Breakfast, Lunch, and Snack were under the bolded theme “Food,” for example, the totals for those three unbolded categories were added together to obtain a total for the theme of “Food.” These theme totals were used for the data analyses.
Four thematic categories were used for the children’s autophotography—Teachers, Friends, Places, or Things. In cases where two were named (e.g., Teachers and Friends), the total percentage was divided between those two theme categories.
Results
Prevalence of Themes in Interviews
Our first research question was “Does the prevalence of themes represented in interviews with children differ by the child’s age or by the school’s “grade” (i.e., an “A” school or an “F” school)?” Analyses of Variance (ANOVAs) were computed on the percentage of each theme that was represented in children’s interviews with school (“A” versus “F”) and grade group (younger or older grade group) as between-subject factors. Table 1 shows percentage of talk by theme for each grade group and each school. In the column with results of statistical analyses, “GG” signifies a significant main effect of grade group, “S” signifies a significant main effect of school, and “GG x S” signifies a significant interaction between grade group and school. As Table 1 shows, a significant interaction was found between grade group and school for the percentage of talk about core academics, F (1, 137) = 21.78, p < .001, and the percentage of talk about teachers, F (1, 137) = 10.29, p = .002. Both ANOVAs also revealed significant main effects of grade group and school (all ps < .01).
Children at the “A” school talked significantly less about core academics (i.e., math, reading, writing, etc.) than did children at the “F” school. This finding was true particularly for the children in the kindergarten through second-grade group at the “A” school, who talked significantly less about academics than did the older children at the “A” school and than all participating children at the “F” school. Virtually no differences were found between grade groups at the “F” school with regard to talk about core academics.
Children in the “F” school’s older grade group talked much more about teachers than did those in the younger grade group. In contrast, the amount of talk about teachers was similar for the two grade groups at the “A” school. Children at the “F” school also talked significantly more about evaluation and testing (1.72%), F (1, 137) = 8.08, p < .005, than did children at the “A” school. (In fact, essentially 0% of children in the “A” school early grade group mentioned evaluation and testing.) Overall, interviews with children at the “F” school showed greater emphasis on teachers, testing, and academics than did those with children at the “A” school.
| Theme**/School | Grade Group* | ||
|---|---|---|---|
| Kindergarten to 2nd Grade (n = 120) |
3rd to 5th Grade (n = 28) |
Statistically Significant*** |
|
| Core Academics | GG, S, GG x S | ||
| "A" School | 25% (15%) | 47% (14%) | |
| "F" School | 48% (16%) | 42% (13%) | |
| Teachers | GG, S, GG x S | ||
| "A" School | 2% (4%) | 4% (4%) | |
| "F" School | 2% (3%) | 10% (8%) | |
| Play | GG, S | ||
| "A" School | 14% (11%) | 6% (6%) | |
| "F" School | 7% (6%) | 4% (4%) | |
| Friends | S | ||
| "A" School | 4% (6%) | 3% (4%) | |
| "F" School | 1% (6%) | 1% (4%) | |
| Evaluation/Tests | S | ||
| "A" School | <1% (2%) | 1% (2%) | |
| "F" School | 2% (4%) | 1% (3%) | |
| *Younger = kindergarten to second grade, and Older = third to fifth grade. **Only those themes that had a significant main effect of grade group (GG) and/or a significant main effect of school (S) and/or a significant interaction between grade group and school (GG x S) according to the Analyses of Variance are shown in the table. *** GG = Significant Main Effect of Grade Group, S = Significant Main Effect of School, and GG x S = Significant Grade Group by School Interaction for that theme’s 2 (Grade Group) x 2 (School) ANOVA. |
|||
Children at the “A” school talked significantly more about play than did children at the “F” school, F (1, 137) = 5.71, p = .018. However, it should be noted that children in the older grade group at the “A” school talked significantly less about play than did the younger children there (4.21% in fifth grade overall versus 16.64% in kindergarten), F (1, 137) = 6.85, p = .010. Children in both grade groups at the “A” school also talked more about friends (3.44%) than did children at the “F” school (1.06%).
Prevalence of Themes in Children’s Autophotography
Our second research question was “Does the prevalence of themes represented in children’s autophotography differ by the child’s age or by the school’s “grade” (i.e., an “A” school or an “F” school)? Chi-square analyses looked at the relation between participants’ schools and their inclusion of each theme (Teachers, Friends, Places, and Things) in their autophotography. Significant relations were found for three of the four themes. The means are displayed in Figure 1.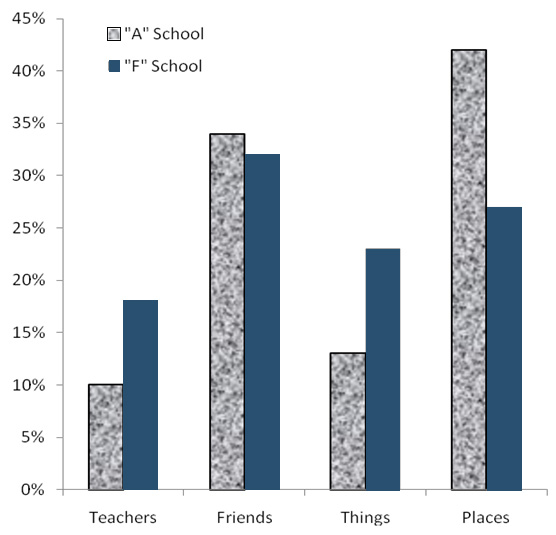 Figure 1. Percentage of children who took at least one photograph of each category by school. Children at the “F” school were significantly more likely than were children at the “A” school to take at least one photograph that included a teacher, χ2 (df = 1) = 4.17, p = .043, and at least one photograph of a thing (e.g., water fountain, papers hanging on a bulletin board), χ2 (df = 1) = 3.79, p = .054. Children at the “A” school were significantly more likely to take at least one photograph of a place (e.g., outside of building, art room), χ2 (df = 1) = 4.38, p = .038. The emphasis on teachers for children at the “F” school as revealed by the photographs they took was consistent with the results of their interviews.
Prevalence of Themes in Picture Selection
Our third research question was “Does the prevalence of themes represented in children’s responses to the picture selection task differ for children from the “A” school and those from the “F” school?” Tables 2 and 3 display all 11 picture selection labels for the stimulus cards that were used for the questions, “Which picture best shows what your school is like?” and “Which picture shows what is most important to you?” From these 11 labels, 5 categories were formed (i.e., the bolded labels) that permitted chi-square analysis, accommodating the fact that when all 11 labels were used as separate categories, too many cells had expected frequencies below 5. The categories “The Teachers” and “My Friends” were kept as individual item categories. The category “Academics” included the items “Reading Books,” “Learning Math,” "Doing Schoolwork,” and “Learning New Things.” The category “Play/Fun” consisted of the items “Play” and “Fun.” Finally, the category “Places at School” included “My Classroom,” “The School Building,” and “The Office.”
Chi-square analysis found a significant relation between school (“A” versus “F” school) and the category of first picture that children selected to best show what their school was like, χ2 (df = 4) = 29.13, p < .001. As Table 2 shows, children at the “A” school were more likely to select photographs representing the categories “Friends” and “Play/Fun,” and children at the “F” school were more likely to select photographs representing the category “Academics.” These findings were similar to the results of the interviews, in which children at the “F” school talked more about academics and less about play and friends. The results for the categories “Teachers” and “Places at School” for the picture selection task had very small differences (i.e., differences less than 10%) between the two schools.
| Theme | School | |
|---|---|---|
| “A” School (n = 120) |
“F” School (n = 28) |
|
| The Teachers | 8% | 14% |
| My Friends | 23% | 7% |
| Academics | 13% | 54% |
| Reading Books | 3% | 4% |
| Learning Math | 4% | 18% |
| Doing Schoolwork | 3% | 21% |
| Learning New Things | 4% | 18% |
| Places at School | 35% | 25% |
| The Classroom | 3% | 21% |
| The School Building | 28% | 0% |
| The Office | 3% | 4% |
| Play/Fun | 21% | 0% |
| Playground | 11% | 0% |
| Having Fun | 10% | 0% |
| Note. Categories that were included in the chi-square analysis are bolded. Unbolded items were the original picture labels and were combined to form the bolded category listed above them. | ||
A chi-square analysis was computed to determine whether there was a significant relation between school and the category of photographs children selected to answer the question, “Which is most important to you?” Again, a significant relation was found between category and school, χ2 (df = 4) = 17.92, p = .001. As Table 3 shows, children at the “A” school were far more likely to select photographs representing “Friends” and “Places,” and children at the “F” school were far more likely to select the photographs representing “Academics.”
| Theme | School | |
|---|---|---|
| “A” School (n = 120) |
“F” School (n = 28) |
|
| The Teachers | 14% | 14% |
| My Friends | 28% | 7% |
| Academics | 18% | 54% |
| Reading Books | 1% | 4% |
| Learning Math | 4% | 18% |
| Doing Schoolwork | 4% | 21% |
| Learning New Things | 8% | 11% |
| Places at School | 32% | 14% |
| The Classroom | 4% | 0% |
| The School Building | 21% | 0% |
| The Office | 7% | 14% |
| Play/Fun | 9% | 11% |
| Playground | 3% | 0% |
| Having Fun | 6% | 11% |
| * Categories that were included in the chi-square analysis are bolded. Unbolded items were the original picture labels and were combined to form the bolded category listed above them. | ||
Among children at the “A” school, choosing “Play” to show what school was like did not carry over to selecting “Play” as most important to them. Whereas 21% of the children at the “A” school selected photographs representing the category Play/Fun to show what their school was like, only 9% selected either of those to represent what was most important to them. The opposite was true at the “F” school. No children at the “F” school chose the photograph representing “Play” in response to either question. None of the “F” school participants selected “Having Fun” to show what school was like, although 11% selected “Having Fun” in response to the question, “Which of these is most important to you?”
Prevalence of Photographs Containing People by Achievement Status within a School
Our fourth research question was “Do children in either school who are less successful academically take fewer photographs and/or select photographs that contain people later than their more academically successful peers?” This question could not be fully addressed; most participants' academic success could not be adequately determined because researchers did not obtain all parents' permission to access children's achievement data at either school, and the assessment data that were collected were not from the same achievement test at both schools. For those children whose achievement test scores were obtained, Pearson r correlations were computed among the math or reading achievement test scores and the percentage of photographs of people for the “A” school and the “F” school separately. A significant correlation was found between achievement in mathematics and the percentage of photographs the 16 children at the “F” school took of people, r = .68, p = .006. The correlation between reading and the percentage of photographs of people for those same 16 children was not significant. However, it should be noted that it was .42, p = .115. The correlations between achievement test scores and the percentage of photographs of people for 51 children at the “A” school were scarcely above 0. They were r = -.08, p = .50, for reading achievement and r = .03, p = .83, for math.
A final analysis was conducted for children at the “A” school exclusively. We compared those children whose teachers rated them as low achievers nationally with those rated average or high nationally. There was some evidence that these children were less connected to friends overall. Whereas only 40% of the low achievers mentioned at least one friend in the interview, 60% of the average or high achievers did. Whereas none of the low achievers photographed at least one friend, 65% of the average or high achievers did. And whereas only 40% of the low achievers selected the photograph “My Friends” within their top 3 picture selections for the question, “Which picture best shows what your school is like?”, 60% of the average and high achievers did. However, it also should be noted that there were only 5 children who were labeled “low achievers” by the teachers at the “A” school, so this finding should be considered very tentative at the present time.
Discussion
The findings from all three data collection methods suggest several key differences in perceptions about school between children at the “A” school and at the “F” school. First, it was evident that children at the “F” school placed much greater emphasis on academics and much less emphasis on play. That is, the school that seemed to stress academics more heavily for children in early grades was actually the less successful academically later on. Some might assume that children at the higher-achieving school would place more emphasis on academics throughout the grades, but results of this study indicate the opposite.
Although talk about academics during the interviews was less dominant among participants at the “A” school (especially in the younger children’s interviews), when they referred to academics, they usually were specific about what they were learning (e.g., “We’re learning how to divide numbers”). Children at the “F” school were more likely to give the subject’s title (e.g., “We’re learning math”) or to simply talk about “doing work” or doing “stuff” at school. These findings suggest between-school differences in children’s relationships to the content and processes of schoolwork and in their perceptions of support at school for play, fun, and meaningful learning.
Both in their own photographs and their stimulus card selections, children at the “A” school were more likely than those at the “F” school to consider “Places” such as the art or music room, a classroom that was not their own, or the outside of the school building. At the “A” school, a number of the children’s choices at both grade levels seemed to reflect the notion of the school as a community of learners. For example, one kindergartner at the “A” school chose to photograph a representation of the city the fifth-graders had built in the upstairs hallway. She talked about the large buildings that were part of the display. Awareness of the school community (such as the work of other classes) was not reflected in comments or photographs of children at the “F” school. In a sense, the children at the “A” school represented their school as a larger “place” than did the children at the “F” school, whose choices expressed awareness only of their own classrooms, their own teachers, and things immediately around them.
Figure 2 shows a photograph taken by an “A” school third-grader. Fifth-graders there were studying caves and had taken a field trip to explore a cave. The third-grader photographed the older students’ documentation displays, which include photographs of their field trip and their written reports about the experience.
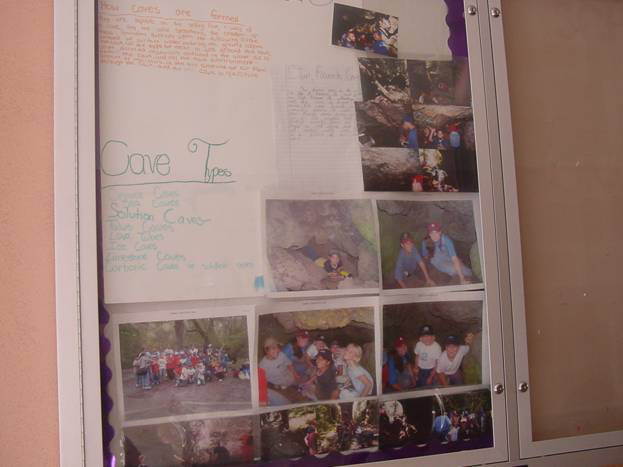 Figure 2. “A” school third-grader’s photograph of a display about caves created by the fifth-grade class.
Relationships with others seemed to be an important part of children’s school experience at the “A” school, especially for the younger grade group. The category “Friends” appeared much less frequently among children’s responses at the “F” school. The percentage of talk about friends was three times lower for children at the “F” school than for children at the “A” school. Children at the “A” school were also three times more likely than children at the “F” school to select the “Friends” stimulus card as best showing what school was like and four times more likely to select it as showing what was most important to them. It is possible that having less available time for play at the “F” school meant that children there had fewer opportunities to make friends than children did at the “A” school. It is also possible that children at the “F” school had more friends outside their school than inside; our methods did not focus on what happened away from school.
At the “F” school, talk about play and friends and selection of photographs that represented play or having fun were less evident than at the successful “A” school. Children’s responses at the unsuccessful “F” school were dominated by references to teachers and academic activities. Some children in the younger grade group in the “F” school talked about testing and other evaluations; among the younger grade group at the “A” school, no children talked about testing and evaluations.
A number of the children at the unsuccessful school selected the photograph representing “Having Fun” as being the one that showed what was most important to them. Yet none selected that photograph to show what their school was actually like. Is it possible that emphasizing academics and testing early in a child’s school career makes school a less-desirable place to be overall? Is it possible that such emphasis early on was actually detrimental to children’s later learning?
The results of the present study suggest possible distinctions between the ways that children at a successful and an unsuccessful school perceive their schools. It should be noted that all of the results reported here are correlational. One cannot assume that having friends, having fun, and having fewer academics or less evaluation in the early grades will cause children to be more successful academically. Perhaps having many students who are low achievers creates pressure on schools to limit opportunities for play and friendship building and to place more emphasis on academics. One wonders if the teachers at the “F” school thought that was the best approach for working with the young children in their classes.
Whatever the reasons for these correlations, it is also apparent that the successful school had more differentiation between what happened in the early primary grades and what happened in third to fifth grades through the children’s eyes.
Recommendations for Future Research
Autophotography is a relatively new method to use with young children. Using it in conjunction with interviews and the picture selection task, the researcher may get a fairly complete picture of what a school is like through children’s eyes. Additional research might further explore use of this approach to address questions in other contexts.
For example, do children at other “successful” schools make picture selections and take photographs that suggest more connectedness to friends than do peers at unsuccessful schools? How might high achievement be related to children’s expressed connections to others? Would changing the climate of an unsuccessful school to promote friendships also promote higher achievement? Additional demographic data might help to clarify whether the apparent connection between low achievement and fewer connections to friends is related to family transiency. If lower-achieving children are those who are more likely to move frequently, is that why they are less connected to others and why they do not do as well in school? Could we learn whether children are at risk for academic failure if they do not take a photograph including a friend or if their top three picture selections do not include photographs representing people? To answer this question would require following children longitudinally from their first year of school throughout elementary school to see how their talk, photographs, and picture selections change with age, and whether absence of friends in the early years predicts later academic difficulty.
In future studies, it might be fruitful to ask more-specific questions about children’s particular classroom experiences and to have the children take photographs to answer those questions. For example, instead of asking children to show others, “What is your school like?” researchers might ask such questions as, “What are you learning?” or “How do you learn to solve math problems in your classroom?” or “What is reading like in your classroom?” Would the children’s selections highlight important differences in teaching style?
Another possibility for future research would be to add observations of classroom instruction, calculating the proportions of the day spent on academics and on play, and then relating those figures to the ways that children talk about, photograph, and select pictures to show others what they are learning at school. Might an optimal balance between play and academics be discovered?
Future studies might look at how children of different racial or ethnic groups experience the same school. This study did not address demographic differences other than grade group. Comparing children’s perceptions of school with their teachers’ perceptions might also be interesting. It could also be useful to focus on a school with a wider achievement spread, comparing the perspectives of lower-achieving children with those of average- and higher-achieving peers there.
Conclusion
In combination, the three methods employed in this study—interviews, autophotography, and picture selection—seemed to reveal important differences in children’s perceptions of what their schools were like, enabling differentiation among some key aspects of the perspectives of children attending schools that had been given strongly contrasting evaluations (“successful” and “unsuccessful”). Interviews, autophotography, and picture selection did not simply duplicate one another’s findings; each method added to what was learned about how the children perceived their schools. This approach appears to hold promise for future research on schools from a “bottom-up” perspective (Katz, 1993), which may enhance understanding of a school’s long-term impact on children’s lives.
Acknowledgments
This research was supported by a Faculty Development Grant from the University of South Florida (#1725943RO) and a College of Education Mini-Grant. Some of the undergraduate students who helped to collect or to code the data were supported by stipends from the Office of Undergraduate Research at the University of South Florida. We thank the following undergraduate and graduate students for their assistance with data collection or data coding for one of the schools in the present study: Sabrina Kirplani Pooran, Elizabeth Decent, Kelly Foyle, Julie Hacker, Ben Graffam, Julie Griess, Amy Eagles, Marisa Foyle, Christopher M. Reyes, the USF students in EDF 4111, and Dr. Patricia Alvarez McHatton and her USF undergraduate students who were majoring in special education.
References
Akeret, Robert U. (2000). Photolanguage: How photos reveal the fascinating stories of our lives and relationships. New York: W.W. Norton.
Cross, Christopher T. (2004). Political education: National policy comes of age. New York: Teachers College Press.
DeMarie, Darlene. (2001). A trip to the zoo: Children’s words and photographs. Early Childhood Research & Practice. Retrieved May 25, 2010, from http://ecrp.illinois.edu/v3n1/demarie.html
DeMarie, Darlene; Foyle, Kelly; & Mulé, Kim. (2010). Age differences in children's perceptions of school revealed through three methods of data collection. Manuscript submitted for publication.
Dorn, Sherman. (1998). The political legacy of school accountability systems. Educational Policy Analysis Archives, 6(1). Retrieved May 25, 2010, from http://epaa.asu.edu/epaa/v6n1.html
Florida Department of Education. (2010). What is the Florida Comprehensive Assessment Test (FCAT)? Retrieved January 14, 2010, from http://fcat.fldoe.org/aboutfcat/english/about2.html#q2
Ganger, Jennifer, & Brent, Michael R. (2004). Reexamining the vocabulary spurt. Developmental Psychology, 40(4), 621-632.
Harper, Douglas. (2002). Talking about pictures: A case for photo elicitation. Visual Studies, 17(1), 13-26. Retrieved May 25, 2010, from http://www.informaworld.com/smpp/content~db=all~content=a713781470
Hayden, Carol, & Ward, Derek. (1996). Faces behind the figures: Interviews with children excluded from primary school. Children and Society, 10(4), 255-266.
Katz, Lilian G. (1993). Five perspectives on quality in early childhood programs. Retrieved May 25, 2010, from http://ecap.crc.illinois.edu/eecearchive/books/fivepers.html
Kirova, Anna; Fauza, Mohamed; & Emme, Michael. (2006). Learning the ropes, resisting the rules: Immigrant children’s representation of the lunchtime routine through fotonovela. Journal of the Canadian Association for Curriculum Studies, 4(1), 73-96. Retrieved May 25, 2010, from http://pi.library.yorku.ca/ojs/index.php/jcacs/article/viewFile/16997/15799
Lee, Jaekyung, & Wong, Kenneth K. (2004). The impact of accountability on racial and socioeconomic equity: Considering both school resources and achievement outcomes. American Education Research Journal, 41(4), 797-832.
National Commission on Excellence in Education. (1983). A nation at risk: The imperative for education reform. Washington, DC: Author.
Orne, Martin T. (1962). With particular reference to demand characteristics and their implications. American Psychologist, 17(11), 776-783.
White, Rebecca; Sasser, Diane; & Bogren, Richard, & Morgan, Johnny. (2009). Photos can inspire a thousand words: Photolanguage as a qualitative evaluation method. Journal of Extension, 47(3), 1-5. Retrieved May 25, 2010, from http://www.joe.org/joe/2009june/pdf/JOE_v47_3iw1.pdf
Yell, Mitchell L., & Drasgow, Erik. (2005). No Child Left Behind: A guide for professionals. Upper Saddle River, NJ: Pearson.
Ziller, Robert C. (1990). Photographing the self: Methods for observing personal orientations. Newbury Park, CA: Sage.
Ziller, Robert C., & Rorer, Brent A. (1985). Shyness-environment interaction: A view from the shy side through auto-photography. Journal of Personality, 53(4), 626-639.
Author Information
Darlene DeMarie is an associate professor of educational psychology at the University of South Florida in Tampa. She was a Fulbright Scholar to South Africa for 2007-2008 and 2008-2009 and co-founded the University of Limpopo's Child Development Centre. Previously, she was the faculty administrator of Muskingum College's Center for Child Development until 1998 and the co-founder and co-director of Muskingum College's Early Childhood Summer Training Institute (ECSTI) until 1997. She also taught grade 1, grade 2, and students with learning disabilities/behavior disorders in grades 1 to 3 and 7 and 8 in Ohio. Her current research focuses on children's memory development and how children perceive the environment in which they learn.
Darlene DeMarie
University of South Florida
4202 East Fowler Ave. - EDU 105
Tampa, FL 33620-5650
Email:
demarie@usf.edu
Appendix A
Labels Used for the Picture Selection Task Stimulus Cards
The Teachers (Photo of all teachers in the study who were at the participant’s school)
My Friends (Photo of all children in the participant’s class)
My Classroom (Photo of only the participant’s classroom; no people included)
Doing Schoolwork (Photo showing only a worksheet and a pencil. The same photograph was utilized for both schools.)
Learning New Things (Photo showing projects children had done with their unit studies at that school and/or learning topics reflected on a bulletin board at the child’s school)
Playing (Photo of jungle gym outside the school building)
The Office (Photo of the entrance to the office of the child’s school, also showing office staff members)
Having Fun (Photo that participating teachers thought would represent having fun to the children in their classes. For example, we used a photograph of children running outside of the school building.)
Reading Books (Photo of library book shelf that showed only the books. The books were ones from which children in the primary grades could select.)
Learning Math (Photo of whatever the participant’s teacher thought would represent learning math in her classroom. It was usually represented by a visible math workbook page matched to child’s grade level or math manipulatives.)
The School Building (Photo that displayed the entrance side of the participant’s school building, which a child would see when approaching the school)
Appendix B
Coding Categories for the Verbal Interviews
- School Structure
Developmental**
Home Base**
Switch Classes**
Classroom
Buses**
Naps - Stuff
- Homework
- Evaluations
Tests
Grades
Points - Behavior Management
- Fun
- Going Home/Coming to School*
- No response/I don’t know
School Climate- Positive Affect (like)*
- Negative Affect (dislike)*
- Pets/Animals*
- Parties/Celebrations*
- Places at School*
- Implications of Education*
- Socializing*
- Core Academics
Math
Reading/Lang. Arts
Writing
Spelling
Social Studies/Science
ABCs
Colors
Calendar - Academic Related
Library/Media Center
Centers
Morning Meetings*
Computers
Field Trips*
Movies*
- Work
- Learn
- Special Activities
Specials
PE
Art
Music - Teachers
- Friends
- Other People
- Play/Recess/Games
- Food
Lunch
Snack
Breakfast*
*Coding categories that were not included in DeMarie et al. (2010) that were added for the present study.
**Coding categories that were included in DeMarie et al. (2010) that were not used in the present study.